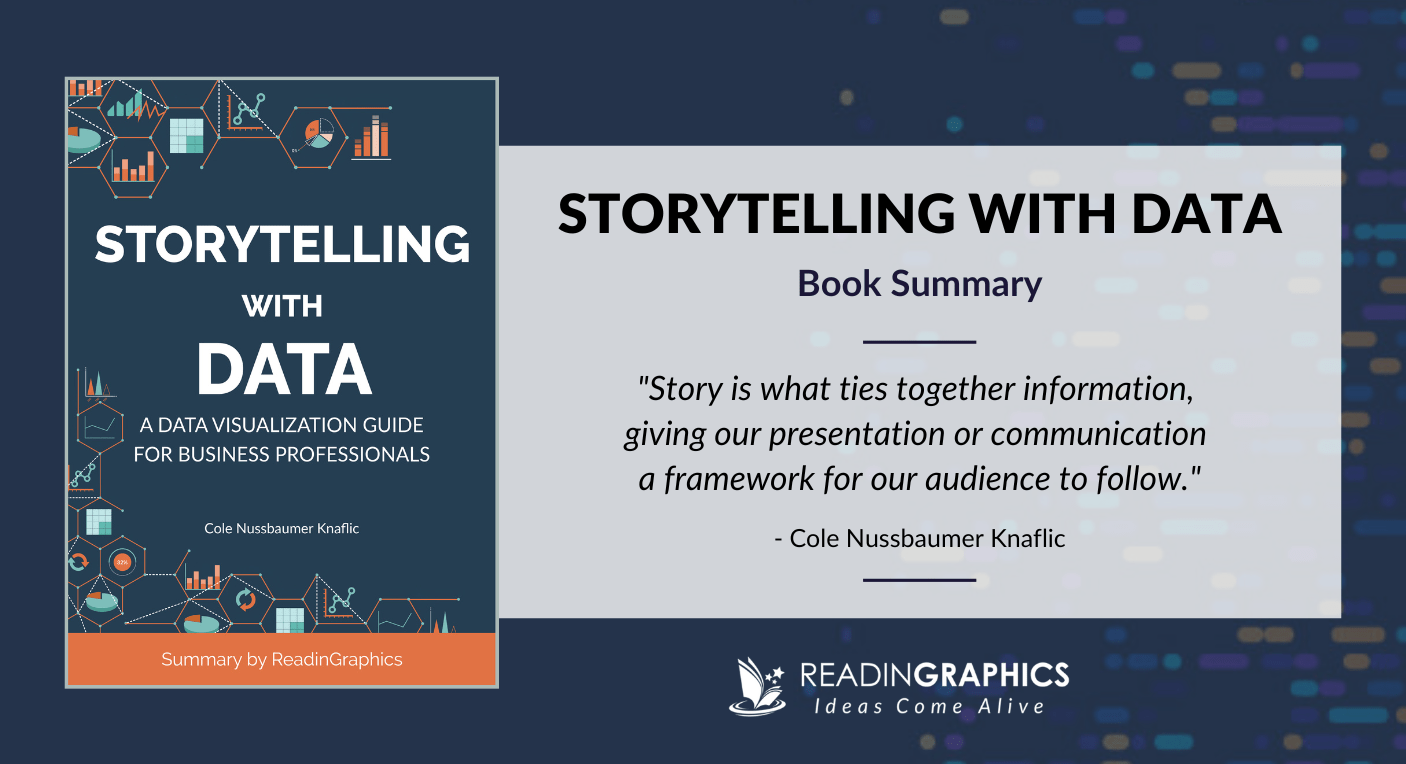
Immerse yourself in the transformative realm of storytelling with data,were numbers dance to reveal compelling narratives. Enrich your audience’s understanding by unlocking the hidden potential of data through captivating visuals, insightful anecdotes, and a keen eye for detail. As you embark on this journey, discover the power to transform raw data into an irresistible feast of knowledge, one that sparks curiosity, ignites imaginations, and leaves an enduring mark on your listeners’ minds.
– Turning Numbers into Narratives: The Art of Data Storytelling
Strategies to Captivate Your Audience with Data Storytelling
Create engaging narratives by following these strategies:
- Connect with emotions: Understand your audience’s motivations and pain points to deliver a message that resonates with their hearts.
- Visualize data effectively: Charts, graphs, and infographics make complex data accessible and memorable.
- Use storytelling techniques: Employ storytelling structures, characters, and conflict to make your data relatable and engaging.
- Provide context and insight: Explain the importance of your findings and connect them to the audience’s experiences to foster understanding.
- Be concise and impactful: Present your message in a clear and captivating manner, avoiding jargon and data overload.
– Crafting a Captivating Storyline: Structure and Sequencing
A well-crafted storyline forms the backbone of an engaging data narrative. Structuring this narrative around familiar elements of storytelling strengthens its impact and ensures a logical flow. Begin with a compelling hook that captivates your audience, setting the stage for your data journey. Develop a narrative arc that introduces key data points as milestones, helping the audience connect emotionally with the unfolding story. Utilize sequencing techniques to avoid jarring transitions, guiding the audience through the data-driven narrative in a coherent manner.
- Enhancing Impact through Visuals: Choosing the Right Charts and Graphs
Choosing the Right charts and Graphs
Visuals are a key component of effective storytelling. The right chart or graph can make your data come to life and help your audience understand your message. But with so many different options, it can be challenging to know wich one is right for your needs. Here are a few things to consider when choosing a chart or graph:
The type of data you have. Some charts work better for certain types of data than others. For example, bar charts are a good choice for comparing different values, while line charts are better for showing trends over time. The message you want to convey. What do you want your audience to take away from your data? The chart or graph you choose shoudl support your message and make it easy for your audience to understand.
* The audience you’re presenting to. Consider the level of technical expertise of your audience. If your audience is not familiar with data visualization, you may want to choose a simple chart or graph.
Here is a table that summarizes some of the most common types of charts and graphs and their uses:
| Chart Type | Use |
| ———– | ———– |
| Bar chart | Comparing different values |
| Line chart | Showing trends over time |
| Pie chart | Showing the proportions of a whole |
| Scatter plot | Showing the relationship between two variables |
| Histogram | Showing the distribution of data |
- Personalizing the Data: Making it Relatable and Meaningful
Personalizing the Data: Making it Relatable and Meaningful
Data is often presented in impersonal and abstract ways, making it difficult for audiences to connect with and understand. To make your data storytelling truly captivating, use techniques that personalize the information and give it a human face. Consider using real-life examples that resonate with your audience’s experiences,such as:
Case studies showcasing how individuals have benefited from your product or service
testimonials demonstrating the positive impact of your initiatives
* Anecdotes that illustrate complex concepts in an engaging and relatable way
In Retrospect
And thus,the curtain falls on our exploration of storytelling with data. We have delved into the art of weaving narratives from numbers, transforming the mundane into the captivating. Remember, data is not merely a collection of facts; it is a canvas upon which you can paint vivid pictures that resonate with your audience. Embrace the power of storytelling, and let your data take center stage as you ignite imaginations and inspire action.


